Global warming has shrunk it, but Canada is expanding its sea ice map – RCI
Posted On:
0Shares
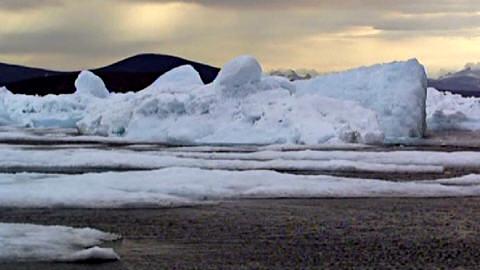
The polar ice pack continues to shrink.
The Canadian federal government’s new map surprises some climate researchers.
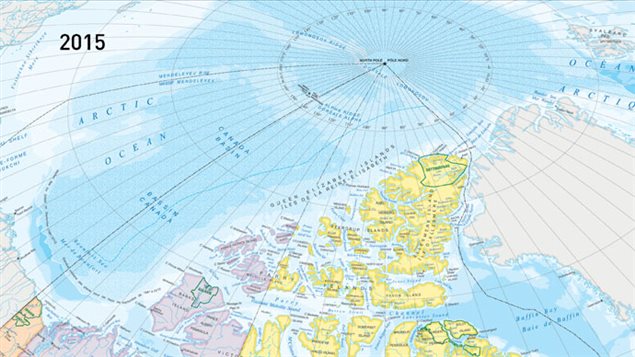
The new update shows much larger Arctic sea ice than in 2006, despite sea ice loss due to polar warming.
A bloom of textured white covers parts of the Beaufort Sea that looked like bare water on the map eight years ago.
A before-and-after comparison shows how the ice has gained importance in the minds of officials at Canada’s Ministry of Natural Resources.
There are many other white areas where there were shades of blue.
..
A scientific explanation and not a political vision
The fundamental difference is that the 2014 map, released this week by Natural Resources Canada, uses a new way of representing sea ice, explains Yvan Désy, director of the Canadian Centre for Remote Sensing. “The calculation method is completely different,” he explains.
The revised methodology is indeed in line with international standards. The new map is based on a mean ice level for the month of September, calculated over the 30 years between 1981 and 2010.
In comparison, the previous map showed only permanent polar ice, says Denis Dubé, senior meteorologist at the Canadian Ice Service.
In a certain sense, the previous depiction of only the polar ice was “fictional”, said Mr Dubé.
Non-governmental scientists are divided
Robert McLeman, an associate professor in the Department of Geography at Wilfrid Laurier University in Waterloo, Ontario, condemns the new official map, describing this new cartographic approach with the word “sham.”
However, according to Chris Brackley, chief cartographer at Canadian Geographic, there are many ways to break down the same data.
“It’s not better, it’s not worse, it’s just a different graphic approach,” said Brackley, who is currently completing the drawing of a circumpolar map that will be distributed free of charge to Canadian schools.
“There is a problem when you try to represent something as dynamic as sea ice, which changes from hour to hour,” he said.
Cheat sheet… Melting Canadian sea ice
In 2013, the World Meteorological Organization (WMO) reported a “record melt” of Arctic ice in 2012.
In its annual climate report, the UN body stressed that “record melting” of Arctic sea ice recorded in August-September 2012 (3.41 million km2) had resulted in an area 18% lower than the previous low area record in 2007 (4.18 million km2).
“The 2012 figure represents a 49% decrease compared to the average minimum for the period 1979-2000,” the organization added.
As a direct result of the existence of a minority government in Quebec, the National Assembly voted unanimously on motions opposing the Harper government. If he could, Jean Charest would have avoided scratching the federal government. Quebec – A unanimous
A proposal for a new electoral map for Quebec was presented to the National Assembly on Tuesday by the Commission on Electoral Representation (CRE), with the law requiring such an election after two parliamentary elections. The main changes proposed concern
Where can you see fall colours in Quebec? As fall begins, there are plenty of incredible activities to do in Montreal, whether it’s apple picking, visiting pumpkin patches, exploring corn mazes or strolling through the city’s public markets. But we
Authorities for the Quebec Liberal Party (PLQ) will review the follow-up to the arrest of former Deputy Prime Minister Nathalie Normandeau this week, a spokesman said. The Legal Affairs Committee and the Ethics Committee, which are dealing with the matter,
The Indian Status Card is an unusual document: it is full of meaning. This numbered polymer rectangle is not only a symbol of the racist principles on which Canada was built, but can also be an object of desire, victimizing
Canada, when French was a language of resistance, it can be said that it still is. Here is a story that begins in Saint-Malo in the 16th century: on April 20, 1534, the navigator Jacques Cartier set off west with


;Composite=(type=URL,url=https://images.radio-canada.ca/v1/assets/elements/16x9/outdated-content-2015.png),gravity=SouthEast,placement=Over,location=(0,0),scale=1)

;Composite=(type=URL,url=https://images.radio-canada.ca/v1/assets/elements/16x9/outdated-content-2016.png),gravity=SouthEast,placement=Over,location=(0,0),scale=1)
;Composite=(type=URL,url=https://images.radio-canada.ca/v1/assets/elements/16x9/outdated-content-2020.png),gravity=SouthEast,placement=Over,location=(0,0),scale=1)
